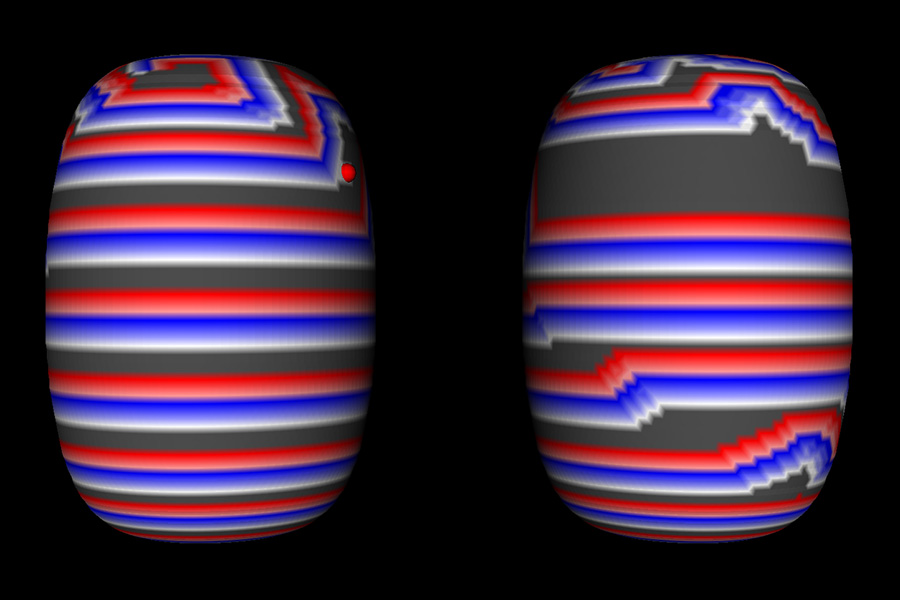
Visualizations of simulation results involving uterine activity in human birth process Mel Barclay, MD. The simulation was done by using cellular automaton. Each cell can have one of 8 states and the coloring is done based on the state.
All data was provided by Mel Barclay, MD. He is an Associate Professor Emeritus, Obstetrics and Gynecology, Medical School.
State |
Propagating |
Pressure |
Refractory |
StateNI |
Color |
7 |
1 |
0 |
1 |
6 |
#FFFFFFF |
6 |
0 |
1 |
1 |
5 |
#9999FF |
5 |
0 |
1 |
1 |
4 |
#4444FF |
4 |
0 |
1 |
1 |
3 |
#0000FF |
3 |
0 |
0 |
1 |
2 |
#FF9999 |
2 |
0 |
0 |
1 |
1 |
#FF4444 |
1 |
0 |
0 |
0 |
7 if K else 0 |
#FF0000 |
0 |
0 |
0 |
0 |
7 if K else 0 |
#444444 |
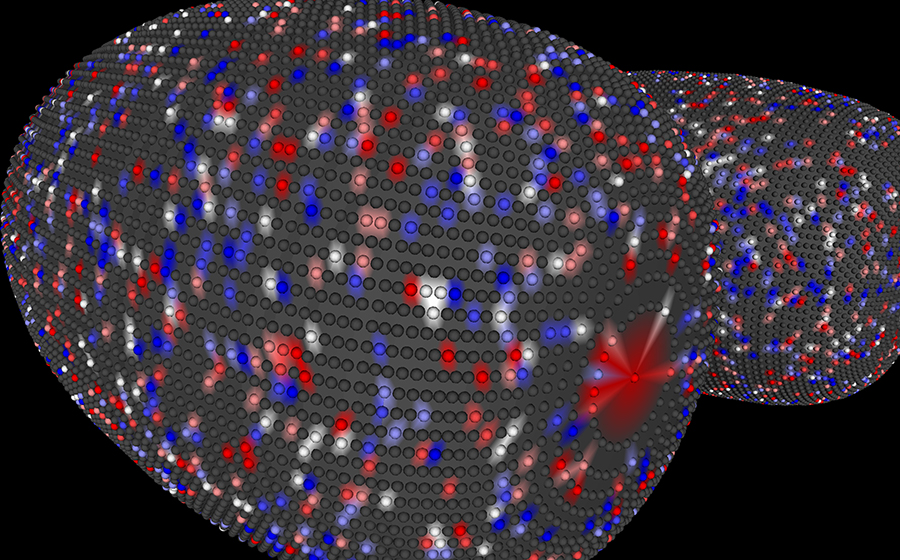
This shows the density of the cellular automata grid.
VRML models
- Initial Color Test
- Test
- Startup
- Emergence