There are really good Google Earth documentation and examples available on the web. You should definitely check out Google's site.
Radar
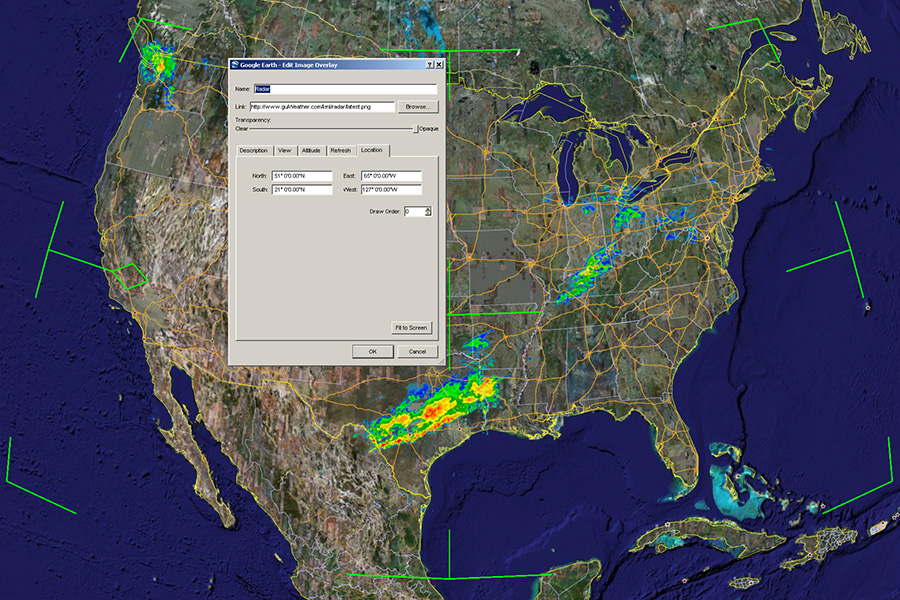
This is a really simple example. An image is constantly downloaded (every 60s) and overlayed with a rectangular area. The tags <north>, <south>, <east> and <west> refer to the bounding box, not the units. So <east>-65</east> means, that the eastern bounder of the image is 65° west of the meridian. The image has to be transparent, so .PNG is a good file format. You can check out the original image (it is large: 6200x3000). Also, here is a link to the file radar.kml ![]() .
.
<?xml version="1.0" encoding="UTF-8"?>
<kml xmlns="http://earth.google.com/kml/2.2">
<GroundOverlay>
  <name>Radar</name>
  <Icon>
    <href>http://www.guiWeather.com/kml/radar/latest.png</href>
    <refreshMode>onInterval</refreshMode>
    <refreshInterval>60</refreshInterval>
  </Icon>
  <LatLonBox>
    <north>51</north>
    <south>21</south>
    <east>-65</east>
    <west>-127</west>
  </LatLonBox>
</GroundOverlay>
</kml>
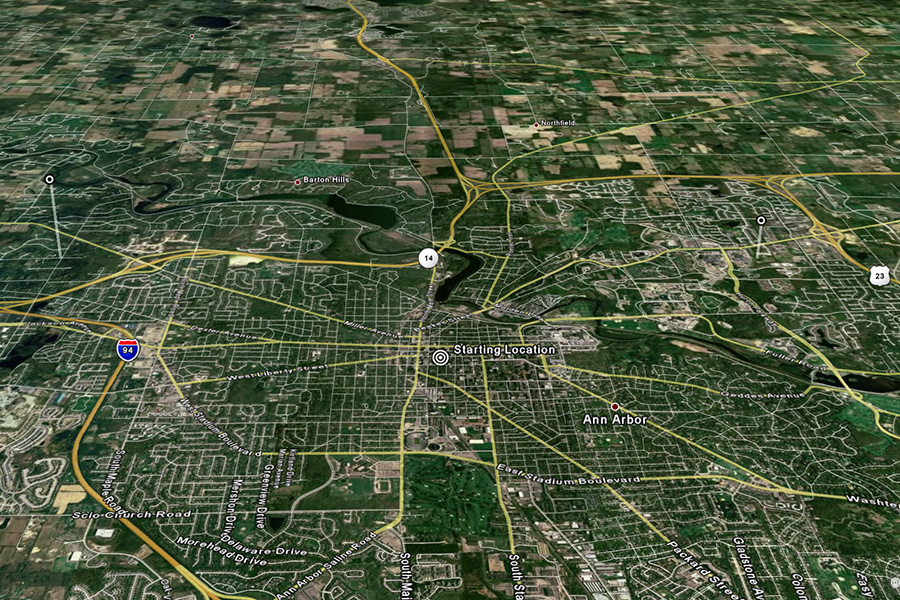
Anim01
This example is already a little more complex. I started with a text description of all the point I want to animate. The different components are separated by comma anim.csv.
2007-01-01,121.0,17.0,10000,green
2007-01-02,119.7,17.0,12000,green
2007-01-03,118.5,16.5,14000,green
2007-01-04,117.6,16.1,16000,green
2007-01-05,117.3,16.0,18000,green
2007-01-06,117.0,15.4,20000,yellow
...
The format is pretty simple - the columns are: "time", "longitude", "latitude", "altitude", and "status". The status can be one of these elements ["green", "yellow", "red"].
I wrote a small Perl script create_kml.pl that reads this file and creates a .KML file. You can download the result anim.kml ![]() .
.
It is very important that you define the style of a <Placemark> before you use it. This is useful if the same style is needed for multiple <Placemake>. Here is the definition of one:
...
<Style id="red">
  <IconStyle>
    <scale>0.5</scale>
    <Icon>
      <href>red.png</href>
    </Icon>
  </IconStyle>
  <LabelStyle>
    <scale>0.5</scale>
  </LabelStyle>
  <LineStyle>
    <color>7f0000ff</color>
    <width>5</width>
  </LineStyle>
</Style>
...
The following icons are used: ![]()
![]()
![]()
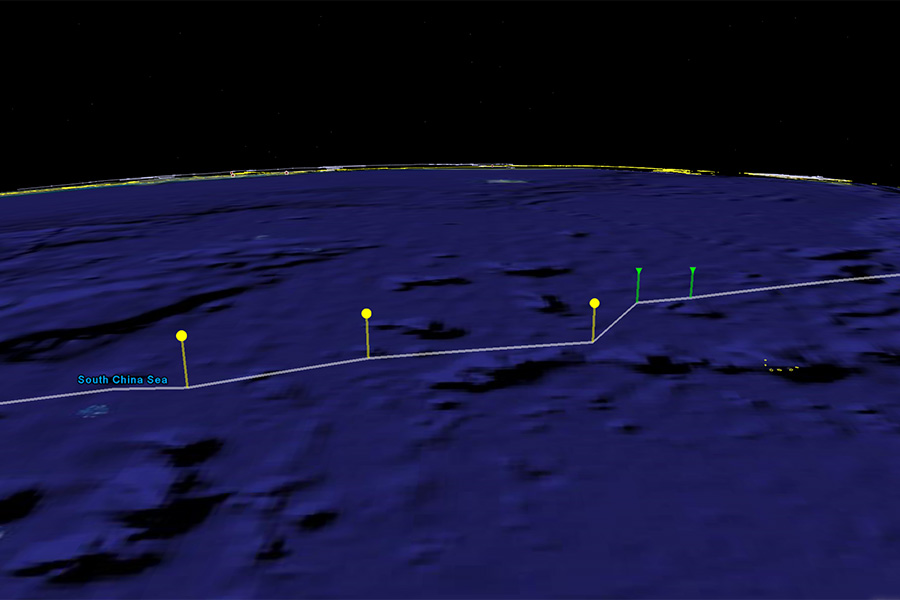
The track is just a special <Placemark> which uses the <LineString>. The <altitudeMode> describes if the point are relative to the ground or absolute. The <coordinates> can have the altitude as a third component and it is measured in meters. The numbers have to be rather high (depending on your scale) to actually see the <Placemark> above the ground.
...
<Placemark>
  <name>Track</name>
  <Style>
    <LineStyle>
      <color>7fffffff</color>
      <width>5</width>
    </LineStyle>
  </Style>
  <LineString>
    <tessellate>1</tessellate>
    <altitudeMode>clampToGround</altitudeMode>
    <coordinates>121.0,17.0 119.7,17.0 118.5,16.5 117.6,16.1 117.3,16.0 117.0,15.4 116.0,15.2 115.3,14.9 115.0,14.9 114.3,14.7 114.0,14.5 113.5,14.6 113.3,14.7 112.9,14.7 112.7,14.8 112.7,15.3 112.9,15.6 112.6,15.7 112.3,15.9 111.9,15.9 111.9,16.1 111.9,16.6 111.6,17.0 111.5,17.4 110.8,17.4 110.3,17.6 110.1,17.6 109.6,17.8 109.0,18.0 108.5,17.6 108.2,17.6 107.8,17.5 107.5,17.7 107.0,17.9 106.5,18.0 105.7,17.8 105.3,17.8 104.5,18.0 103.9,17.7 103.1,18.0 102.0,18.0</coordinates>
  </LineString>
</Placemark>
...
The animation point are pretty simple too. Each point references a style. They also have a <TimeStamp> node in them, which activated Google Earth's animation slider.
...
<Placemark>
  <TimeStamp><when>2007-01-01</when></TimeStamp>
  <styleUrl>#green</styleUrl>
  <Point>
    <extrude>1</extrude>
    <altitudeMode>relativeToGround</altitudeMode>
    <coordinates>121.0,17.0,10000.0</coordinates>
  </Point>
</Placemark>
...
Anim02
The previous example used just one point in time for each <Placemark> by using <TimeStamp>. This example uses <TimeSpan> which allows a duration for a <Placemark>. This code anim.kml ![]() is still very simple:
is still very simple:
...
<TimeSpan>
  <begin>2000-01-01</begin>
  <end>2000-02-01</end>
</TimeSpan>
...
mbus
Check out the mbus page for a real-time demonstration.
WaterNow
Check out the small WaterNow ![]() data set.
data set.
Scio Residents for Safe Water
Check out Scio Residents for Safe Water site for a pretty complex data set.